 |
| Market Cap | 684.13M | EPS (ttm) | 0.90 |
| P/E | 9.04 | EPS this Y | -2.71% |
| Forward P/E | 8.18 | EPS next Y | 12.61% |
| PEG | 0.45 | EPS past 5Y | 40.40% |
| P/S | 0.84 | EPS next 5Y | 20.00% |
| P/B | 3.02 | EPS Q/Q | -92.47% |
| Dividend | 10.29% | Sales Q/Q | -6.36% |
| Insider Own | 3.10% | Inst Own | 93.89% |
| Insider Trans | -3.35% | Inst Trans | -1.68% |
| Short Float | 5.30% | Earnings | May 08/b |
| Analyst Recom | 1.86 | Target Price | 12.43 |
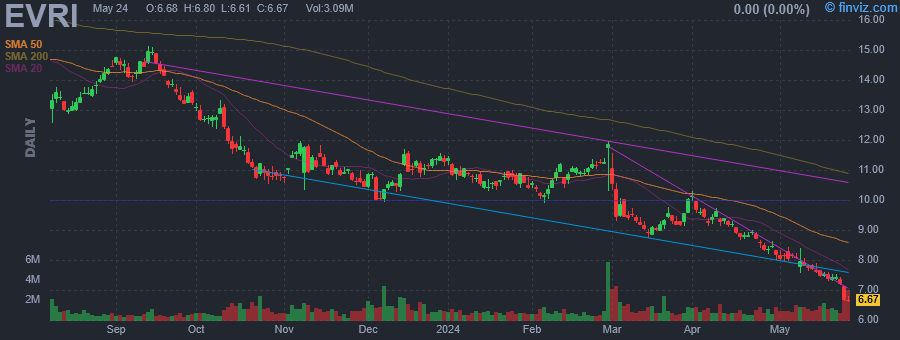
| Avg Volume | 1.15M | 52W Range | 7.99 - 17.85 |
|
|
|
|
Everi Holdings, Inc. engages in the provision of technology solutions to the casino, interactive, and gaming industry. It operates through the Games and Financial Technology Solutions (FinTech) segments. The Games segment focuses on leased gaming equipment, sales of gaming equipment, gaming systems, interactive solutions, and ancillary products and services. The FinTech segment provides access to cash at gaming facilities via ATM cash withdrawals, credit card cash access transactions and point of sale debit card cash access transactions, check-related services, fully integrated kiosks and maintenance services, compliance, audit and data software, casino credit data, and reporting services and other ancillary offerings. The company was founded on February 4, 2004 and is headquartered in Las Vegas, NV. |
| Insider Trading |
Relationship |
Date |
Transaction |
Cost |
#Shares |
Value ($) |
#Shares Total |
SEC Form 4 |
| VALLI TODD A. | SVP, CAO | May 02 '24 | Option Exercise | 6.59 | 15,000 | 98,850 | 64,440 | May 02 09:37 PM | | VALLI TODD A. | SVP, CAO | May 02 '24 | Sale | 8.05 | 15,000 | 120,750 | 49,440 | May 02 09:37 PM | | Simmons Darren | EVP, FinTech Business Leader | May 01 '24 | Option Exercise | 6.59 | 45,000 | 296,550 | 197,550 | May 02 09:34 PM | | Simmons Darren | EVP, FinTech Business Leader | May 01 '24 | Sale | 8.07 | 45,000 | 363,150 | 152,550 | May 02 09:34 PM | | JUDGE GEOFFREY P | Director | Apr 30 '24 | Option Exercise | 6.59 | 30,000 | 197,700 | 121,572 | May 02 09:39 PM |
|
|
 |
 |
| Market Cap | 3.99B | EPS (ttm) | 7.54 |
| P/E | 10.86 | EPS this Y | 1.70% |
| Forward P/E | 9.22 | EPS next Y | 7.21% |
| PEG | - | EPS past 5Y | 12.81% |
| P/S | 1.58 | EPS next 5Y | - |
| P/B | 1.27 | EPS Q/Q | 18.85% |
| Dividend | 1.92% | Sales Q/Q | 25.92% |
| Insider Own | 6.37% | Inst Own | 88.69% |
| Insider Trans | -4.95% | Inst Trans | -0.48% |
| Short Float | 1.37% | Earnings | Apr 30/a |
| Analyst Recom | 1.83 | Target Price | 95.50 |
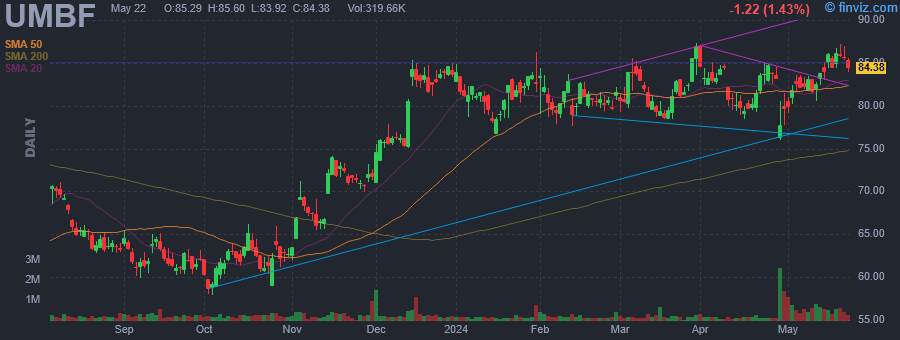
| Avg Volume | 285.76K | 52W Range | 50.68 - 87.36 |
|
|
|
|
UMB Financial Corp. engages in the provision of bank and asset services. It operates through the following segments: Commercial Banking, Institutional Banking, and Personal Banking. The Commercial Banking segment serves the commercial lending and leasing, capital markets, and treasury management needs of the company's mid-market businesses and governmental entities by offering various products and services. The Institutional Banking segment is a combination of banking services, fund services, and asset management services provided to institutional clients. The Personal Banking segment combines consumer banking and wealth management services offered to clients and delivered through personal relationships and the firm's bank branches, ATM network, and internet banking. The company was founded was founded in 1967 and is headquartered in Kansas City, MO. |
| Insider Trading |
Relationship |
Date |
Transaction |
Cost |
#Shares |
Value ($) |
#Shares Total |
SEC Form 4 |
| KEMPER J MARINER | Chairman and CEO | May 01 '24 | Sale | 79.66 | 5,400 | 430,170 | 1,733,204 | May 02 08:39 PM | | KEMPER J MARINER | Chairman and CEO | May 01 '24 | Sale | 80.35 | 4,708 | 378,281 | 1,728,496 | May 02 08:42 PM | | KEMPER J MARINER | Chairman and CEO | May 01 '24 | Sale | 80.56 | 3,790 | 305,337 | 1,724,706 | May 02 09:33 PM | | KEMPER J MARINER | Chairman and CEO | May 01 '24 | Sale | 80.72 | 2,302 | 185,821 | 1,722,404 | May 02 09:36 PM | | KEMPER J MARINER | Chairman and CEO | Apr 01 '24 | Sale | 84.98 | 13,130 | 1,115,833 | 1,749,774 | Apr 03 04:46 PM |
|
|
|
 |
| Market Cap | 8.35B | EPS (ttm) | -0.93 |
| P/E | - | EPS this Y | -21.98% |
| Forward P/E | - | EPS next Y | -38.74% |
| PEG | - | EPS past 5Y | -18.89% |
| P/S | - | EPS next 5Y | 40.00% |
| P/B | 8.94 | EPS Q/Q | -6.06% |
| Dividend | - | Sales Q/Q | - |
| Insider Own | 8.08% | Inst Own | 68.58% |
| Insider Trans | -8.10% | Inst Trans | -0.29% |
| Short Float | 11.00% | Earnings | Apr 24/a |
| Analyst Recom | 1.09 | Target Price | 112.26 |
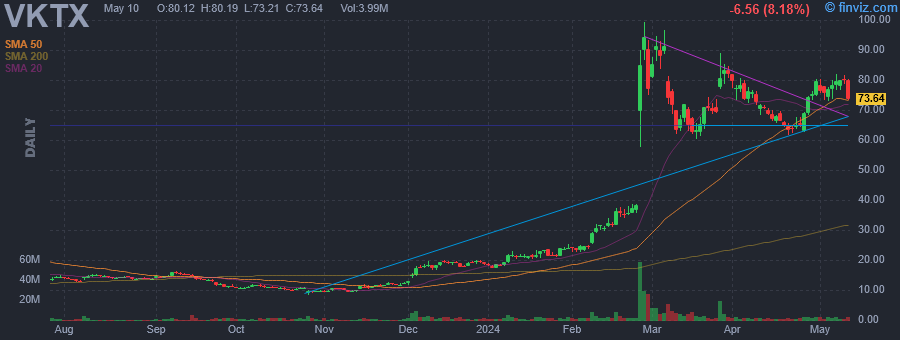
| Avg Volume | 6.52M | 52W Range | 8.28 - 99.41 |
|
|
|
|
Viking Therapeutics, Inc. is a clinical-stage biopharmaceutical company, which engages in the development of therapies for metabolic and endocrine disorders. The company was founded by Brian Lian and Michael A. Dinerman on September 24, 2012 and is headquartered in San Diego, CA. |
| Insider Trading |
Relationship |
Date |
Transaction |
Cost |
#Shares |
Value ($) |
#Shares Total |
SEC Form 4 |
| Mancini Marianna | Chief Operating Officer | May 01 '24 | Option Exercise | 6.18 | 281,425 | 1,740,575 | 629,933 | May 02 09:27 PM | | Mancini Marianna | Chief Operating Officer | May 01 '24 | Sale | 78.66 | 281,425 | 22,136,474 | 348,508 | May 02 09:27 PM | | Lian Brian | President & CEO | Feb 09 '24 | Sale | 29.90 | 45,000 | 1,345,500 | 2,139,882 | Feb 09 08:59 PM | | Lian Brian | President & CEO | Feb 08 '24 | Option Exercise | 3.76 | 189,079 | 711,367 | 2,404,882 | Feb 08 07:40 PM | | Rouan Sarah Kathryn | Director | Feb 08 '24 | Option Exercise | 8.32 | 25,000 | 208,000 | 25,000 | Feb 08 07:38 PM |
|
|
| |
 |
| Market Cap | 1.36B | EPS (ttm) | -2.85 |
| P/E | - | EPS this Y | -33.21% |
| Forward P/E | - | EPS next Y | -12.11% |
| PEG | - | EPS past 5Y | 1.03% |
| P/S | - | EPS next 5Y | -14.60% |
| P/B | 2.05 | EPS Q/Q | -100.87% |
| Dividend | - | Sales Q/Q | - |
| Insider Own | 16.42% | Inst Own | 82.58% |
| Insider Trans | 0.21% | Inst Trans | 18.45% |
| Short Float | 14.16% | Earnings | Feb 29/b |
| Analyst Recom | 1.20 | Target Price | 48.89 |
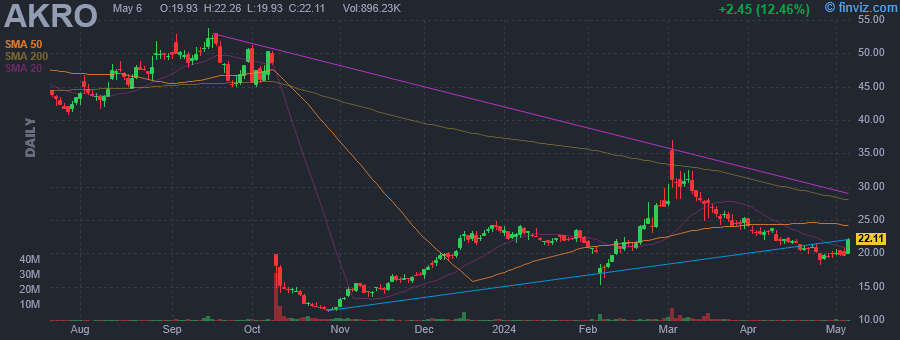
| Avg Volume | 1.41M | 52W Range | 11.25 - 58.38 |
|
|
|
|
Akero Therapeutics, Inc. is a clinical-stage company, which engages in the development of treatments for patients with serious metabolic diseases. The firm's lead product candidate, efruxifermin (EFX), is an analog of fibroblast growth factor 21, or FGF21, which is an endogenously expressed hormone that protects against cellular stress and regulates metabolism of lipids, carbohydrates, and proteins throughout the body. The company was founded by Jonathan Young and Timothy Rolph in January 2017 and is headquartered in South San Francisco, CA. |
| Insider Trading |
Relationship |
Date |
Transaction |
Cost |
#Shares |
Value ($) |
#Shares Total |
SEC Form 4 |
| Young Jonathan | Chief Operating Officer | May 01 '24 | Sale | 20.15 | 5,000 | 100,750 | 258,306 | May 02 09:07 PM | | Young Jonathan | Chief Operating Officer | Apr 01 '24 | Sale | 24.38 | 5,000 | 121,913 | 263,306 | Apr 03 06:55 PM | | Cheng Andrew | President and CEO | Mar 13 '24 | Sale | 28.33 | 1,969 | 55,782 | 589,447 | Mar 15 04:43 PM | | White William Richard | Chief Financial Officer | Mar 13 '24 | Sale | 28.33 | 724 | 20,511 | 49,630 | Mar 15 04:44 PM | | Yale Catriona | Chief Development Officer | Mar 13 '24 | Sale | 28.33 | 723 | 20,483 | 77,692 | Mar 15 04:45 PM |
|
|
|
 |
| Market Cap | 348.23M | EPS (ttm) | -0.52 |
| P/E | - | EPS this Y | 22.29% |
| Forward P/E | - | EPS next Y | 28.60% |
| PEG | - | EPS past 5Y | - |
| P/S | 4.99 | EPS next 5Y | - |
| P/B | 1.30 | EPS Q/Q | 3.60% |
| Dividend | - | Sales Q/Q | 13.30% |
| Insider Own | 41.98% | Inst Own | 27.70% |
| Insider Trans | -0.49% | Inst Trans | 14.57% |
| Short Float | 4.17% | Earnings | May 07/a |
| Analyst Recom | 2.33 | Target Price | 3.88 |
| Avg Volume | 824.97K | 52W Range | 1.10 - 4.02 |
|
|
|
|
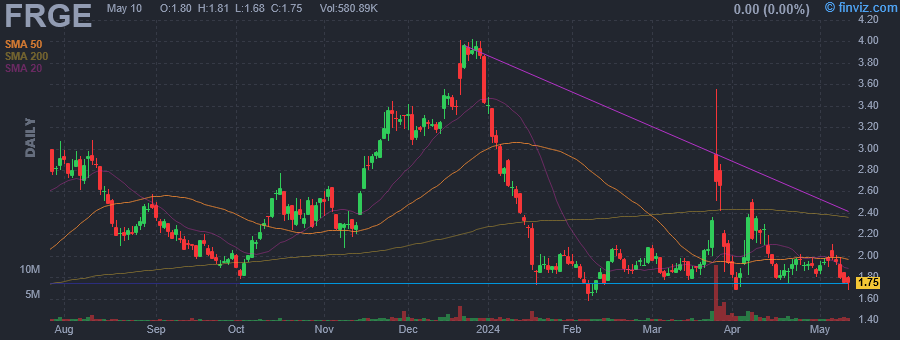
Forge Global Holdings, Inc. engages in providing marketplace infrastructure, data services, and technology solutions for private market participants. It also offers a financial services platform, proprietary data, and insights to inform investment strategies. The company was founded in 2014 and is headquartered in San Francisco, CA. |
| Insider Trading |
Relationship |
Date |
Transaction |
Cost |
#Shares |
Value ($) |
#Shares Total |
SEC Form 4 |
| Rodriques Kelly | Chief Executive Officer | May 02 '24 | Sale | 1.93 | 14,254 | 27,539 | 10,387,708 | May 02 08:59 PM | | Rodriques Kelly | Chief Executive Officer | May 01 '24 | Sale | 1.88 | 35,746 | 67,328 | 10,401,962 | May 02 08:59 PM | | Rodriques Kelly | Chief Executive Officer | Apr 16 '24 | Sale | 1.84 | 20,803 | 38,194 | 10,437,708 | Apr 18 05:57 PM | | Rodriques Kelly | Chief Executive Officer | Apr 02 '24 | Sale | 1.73 | 25,000 | 43,260 | 10,589,550 | Apr 03 06:09 PM | | Rodriques Kelly | Chief Executive Officer | Apr 01 '24 | Sale | 1.84 | 25,000 | 46,040 | 10,614,550 | Apr 03 06:09 PM |
|
|
| |
 |
| Market Cap | 243.56B | EPS (ttm) | 14.41 |
| P/E | 39.21 | EPS this Y | 52.90% |
| Forward P/E | 25.43 | EPS next Y | 20.84% |
| PEG | 1.42 | EPS past 5Y | 35.03% |
| P/S | 6.97 | EPS next 5Y | 27.67% |
| P/B | 11.40 | EPS Q/Q | 83.05% |
| Dividend | - | Sales Q/Q | 14.95% |
| Insider Own | 0.96% | Inst Own | 82.98% |
| Insider Trans | -9.55% | Inst Trans | 3.04% |
| Short Float | 1.51% | Earnings | Apr 18/a |
| Analyst Recom | 1.94 | Target Price | 654.66 |
| Avg Volume | 3.65M | 52W Range | 315.62 - 639.00 |
|
|
|
|
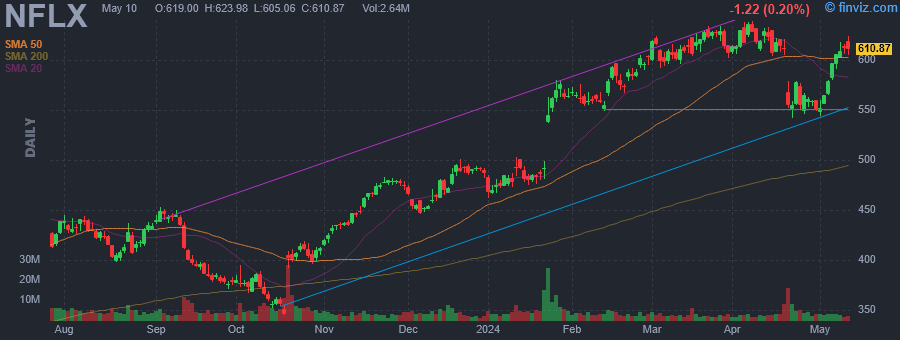
Netflix, Inc. engages in providing entertainment services. It also offers activities for leisure time, entertainment video, video gaming, and other sources of entertainment. It operates through the United States and International geographic segments. The company was founded by Marc Randolph and Wilmot Reed Hastings on August 29, 1997 and is headquartered in Los Gatos, CA. |
| Insider Trading |
Relationship |
Date |
Transaction |
Cost |
#Shares |
Value ($) |
#Shares Total |
SEC Form 4 |
| HASTINGS REED | Executive Chairman | May 01 '24 | Option Exercise | 68.09 | 18,361 | 1,250,122 | 18,389 | May 02 08:32 PM | | Sweeney Anne M | Director | May 01 '24 | Option Exercise | 178.49 | 633 | 112,982 | 633 | May 02 08:43 PM | | HASTINGS REED | Executive Chairman | May 01 '24 | Sale | 551.54 | 18,361 | 10,126,777 | 28 | May 02 08:32 PM | | Sweeney Anne M | Director | May 01 '24 | Sale | 560.00 | 633 | 354,480 | 0 | May 02 08:43 PM | | Sweeney Anne M | Director | Apr 30 '24 | Option Exercise | 189.80 | 2,377 | 451,164 | 2,377 | May 02 08:43 PM |
|
|
|
 |
| Market Cap | 315.97B | EPS (ttm) | 3.78 |
| P/E | 30.38 | EPS this Y | 9.14% |
| Forward P/E | 18.66 | EPS next Y | 10.23% |
| PEG | 2.84 | EPS past 5Y | 29.43% |
| P/S | 6.02 | EPS next 5Y | 10.71% |
| P/B | 56.16 | EPS Q/Q | 24.70% |
| Dividend | 1.34% | Sales Q/Q | 7.11% |
| Insider Own | 41.91% | Inst Own | 43.76% |
| Insider Trans | -0.28% | Inst Trans | 0.28% |
| Short Float | 0.82% | Earnings | Mar 11/a |
| Analyst Recom | 1.97 | Target Price | 140.09 |
| Avg Volume | 8.46M | 52W Range | 93.85 - 132.77 |
|
|
|
|
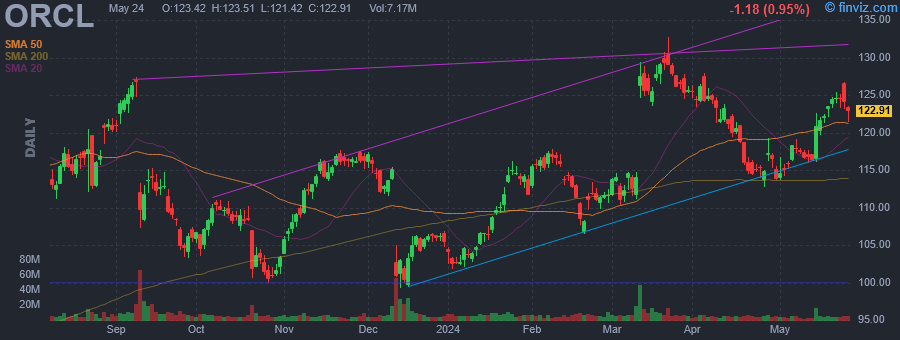
Oracle Corp. engages in the provision of products and services that address aspects of corporate information technology environments, including applications and infrastructure technologies. It operates through the following business segments: Cloud and License, Hardware, and Services. The Cloud and License segment markets, sells, and delivers enterprise applications and infrastructure technologies through cloud and on-premise deployment models including cloud services and license support offerings. The Hardware segment provides infrastructure technologies including Oracle Engineered Systems, servers, storage, industry-specific hardware, operating systems, virtualization, management, and other hardware-related software. The Services segment offers consulting, advanced support, and education services. The company was founded by Lawrence Joseph Ellison, Robert Nimrod Miner, and Edward A. Oates on June 16, 1977 and is headquartered in Austin, TX. |
| Insider Trading |
Relationship |
Date |
Transaction |
Cost |
#Shares |
Value ($) |
#Shares Total |
SEC Form 4 |
| CONRADES GEORGE H | Director | May 01 '24 | Option Exercise | 42.02 | 25,000 | 1,050,500 | 42,836 | May 02 08:35 PM | | CONRADES GEORGE H | Director | May 01 '24 | Sale | 116.13 | 25,000 | 2,903,190 | 17,836 | May 02 08:35 PM | | CATZ SAFRA | Chief Executive Officer | Mar 27 '24 | Option Exercise | 40.47 | 810,000 | 32,779,120 | 1,928,592 | Mar 27 07:02 PM | | CATZ SAFRA | Chief Executive Officer | Mar 27 '24 | Sale | 125.06 | 810,000 | 101,294,608 | 1,118,592 | Mar 27 07:02 PM | | CATZ SAFRA | Chief Executive Officer | Mar 26 '24 | Option Exercise | 39.89 | 790,000 | 31,513,100 | 1,908,592 | Mar 27 07:02 PM |
|
|
| |
 |
| Market Cap | 520.54M | EPS (ttm) | -0.29 |
| P/E | - | EPS this Y | -3275.00% |
| Forward P/E | - | EPS next Y | 40.94% |
| PEG | - | EPS past 5Y | - |
| P/S | 3.81 | EPS next 5Y | 15.00% |
| P/B | 2.89 | EPS Q/Q | -1416.67% |
| Dividend | - | Sales Q/Q | -11.06% |
| Insider Own | 1.11% | Inst Own | 95.04% |
| Insider Trans | 5.54% | Inst Trans | 6.49% |
| Short Float | 16.44% | Earnings | Apr 24/a |
| Analyst Recom | 1.40 | Target Price | 12.50 |
| Avg Volume | 1.37M | 52W Range | 4.07 - 18.86 |
|
|
|
|
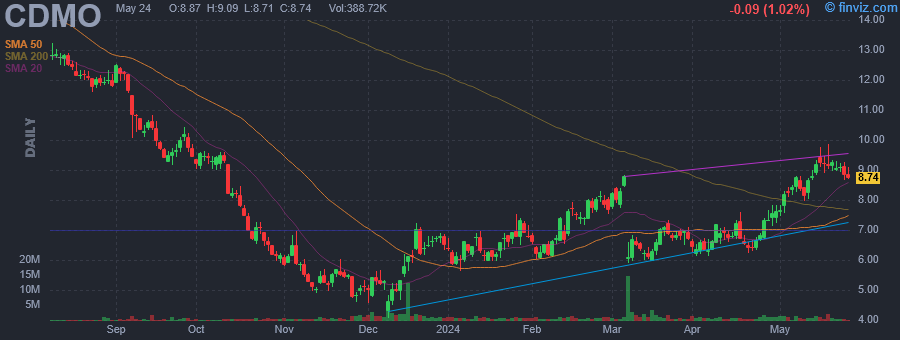
Avid Bioservices, Inc. engages in clinical and commercial manufacturing of biologics. It focuses on the biopharmaceutical products derived from mammalian cell culture for culture for biotechnology and pharmaceutical companies. It specializes in clinical and commercial product manufacturing, purification, bulk packaging, stability testing and regulatory submissions and support. The company was founded on June 3, 1981 and is headquartered in Tustin, CA. |
| Insider Trading |
Relationship |
Date |
Transaction |
Cost |
#Shares |
Value ($) |
#Shares Total |
SEC Form 4 |
| Green Nicholas Stewart | President & CEO | Apr 30 '24 | Sale | 7.40 | 11,762 | 87,028 | 203,606 | May 02 08:20 PM | | Hart Daniel R | Chief Financial Officer | Apr 30 '24 | Sale | 7.40 | 2,826 | 20,910 | 82,221 | May 02 08:20 PM | | Ziebell Mark R | V. P., General Counsel | Apr 30 '24 | Sale | 7.40 | 1,643 | 12,157 | 64,834 | May 02 08:21 PM | | Kwietniak Matthew R. | Chief Commercial Officer | Apr 30 '24 | Sale | 7.40 | 1,233 | 9,122 | 21,797 | May 02 08:20 PM | | Richieri Richard A. | Chief Operations Officer | Apr 30 '24 | Sale | 7.40 | 1,005 | 7,436 | 27,132 | May 02 08:21 PM |
|
|
|
 |
| Market Cap | 16.70B | EPS (ttm) | 21.40 |
| P/E | 13.58 | EPS this Y | -12.43% |
| Forward P/E | 14.50 | EPS next Y | 1.23% |
| PEG | 3.77 | EPS past 5Y | 20.94% |
| P/S | 1.15 | EPS next 5Y | 3.60% |
| P/B | 2.10 | EPS Q/Q | -18.73% |
| Dividend | 1.44% | Sales Q/Q | -8.08% |
| Insider Own | 0.75% | Inst Own | 81.11% |
| Insider Trans | -21.45% | Inst Trans | -4.55% |
| Short Float | 1.19% | Earnings | Apr 25/b |
| Analyst Recom | 2.25 | Target Price | 355.38 |
| Avg Volume | 273.31K | 52W Range | 229.12 - 342.20 |
|
|
|
|
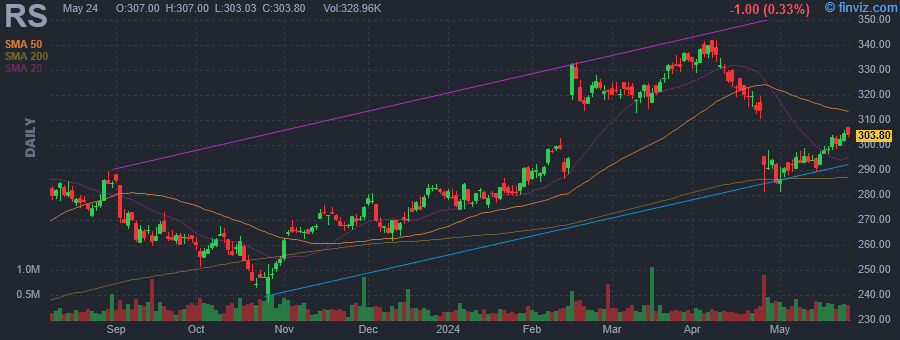
Reliance, Inc. engages in the provision of a metal distribution center. It offers alloy, aluminum, brass, copper, carbon steel, stainless steel, titanium, and specialty steel products. The company was founded by Thomas J. Neilan on February 3, 1939, and is headquartered in Scottsdale, AZ. |
| Insider Trading |
Relationship |
Date |
Transaction |
Cost |
#Shares |
Value ($) |
#Shares Total |
SEC Form 4 |
| HOFFMAN JAMES DONALD | Director | Apr 30 '24 | Sale | 289.81 | 5,000 | 1,449,067 | 49,042 | May 02 07:50 PM | | Ajemyan Arthur | SVP, CFO | Mar 06 '24 | Sale | 322.95 | 3,000 | 968,850 | 15,577 | Mar 06 05:36 PM | | HOFFMAN JAMES DONALD | Director | Feb 27 '24 | Sale | 322.95 | 40,000 | 12,917,867 | 54,042 | Feb 28 06:56 PM | | Lewis Karla R | President, CEO | Feb 20 '24 | Sale | 318.97 | 42,346 | 13,507,138 | 84,534 | Feb 21 07:24 PM | | Lewis Karla R | President, CEO | Feb 16 '24 | Sale | 322.96 | 650 | 209,924 | 83,884 | Feb 21 07:24 PM |
|
|
|
 |
| Market Cap | 3.09B | EPS (ttm) | 0.62 |
| P/E | 51.99 | EPS this Y | 12.19% |
| Forward P/E | 32.14 | EPS next Y | 43.46% |
| PEG | 3.69 | EPS past 5Y | - |
| P/S | 2.84 | EPS next 5Y | 14.10% |
| P/B | 5.55 | EPS Q/Q | 292.08% |
| Dividend | - | Sales Q/Q | 25.95% |
| Insider Own | 13.90% | Inst Own | 87.29% |
| Insider Trans | -4.87% | Inst Trans | -1.63% |
| Short Float | 7.95% | Earnings | May 09/a |
| Analyst Recom | 1.10 | Target Price | 47.10 |
| Avg Volume | 860.52K | 52W Range | 29.44 - 44.95 |
|
|
|
|
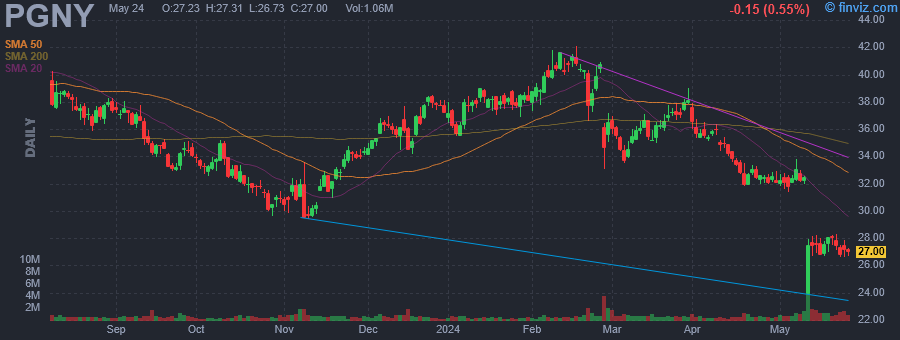
Progyny, Inc. is a fertility benefits management company. It provides fertility solutions to employers, managing IUI, in vitro fertilization (IVF), egg freezing, and other fertility treatments. It operates through one segment: fertility and pharmacy benefits solutions. It also delivers treatment services and access to the firm's network of fertility specialist. The company was founded on April 3, 2008 and is headquartered in New York, NY. |
| Insider Trading |
Relationship |
Date |
Transaction |
Cost |
#Shares |
Value ($) |
#Shares Total |
SEC Form 4 |
| Payson Norman | Director | Nov 23 '24 | Sale | 56.29 | 200 | 11,258 | 580,656 | Nov 26 04:34 PM | | Sturmer Michael E | PRESIDENT | May 01 '24 | Sale | 31.95 | 4,515 | 144,254 | 380,038 | May 02 07:05 PM | | Livingston Mark S. | CHIEF FINANCIAL OFFICER | Apr 01 '24 | Option Exercise | 3.95 | 20,627 | 81,477 | 72,875 | Apr 03 05:16 PM | | Schlanger David J | Executive Chairman | Apr 01 '24 | Option Exercise | 3.95 | 1,000 | 3,950 | 87,312 | Apr 03 05:27 PM | | Livingston Mark S. | CHIEF FINANCIAL OFFICER | Apr 01 '24 | Sale | 37.62 | 11,165 | 419,979 | 50,119 | Apr 03 05:16 PM |
|
|
|
